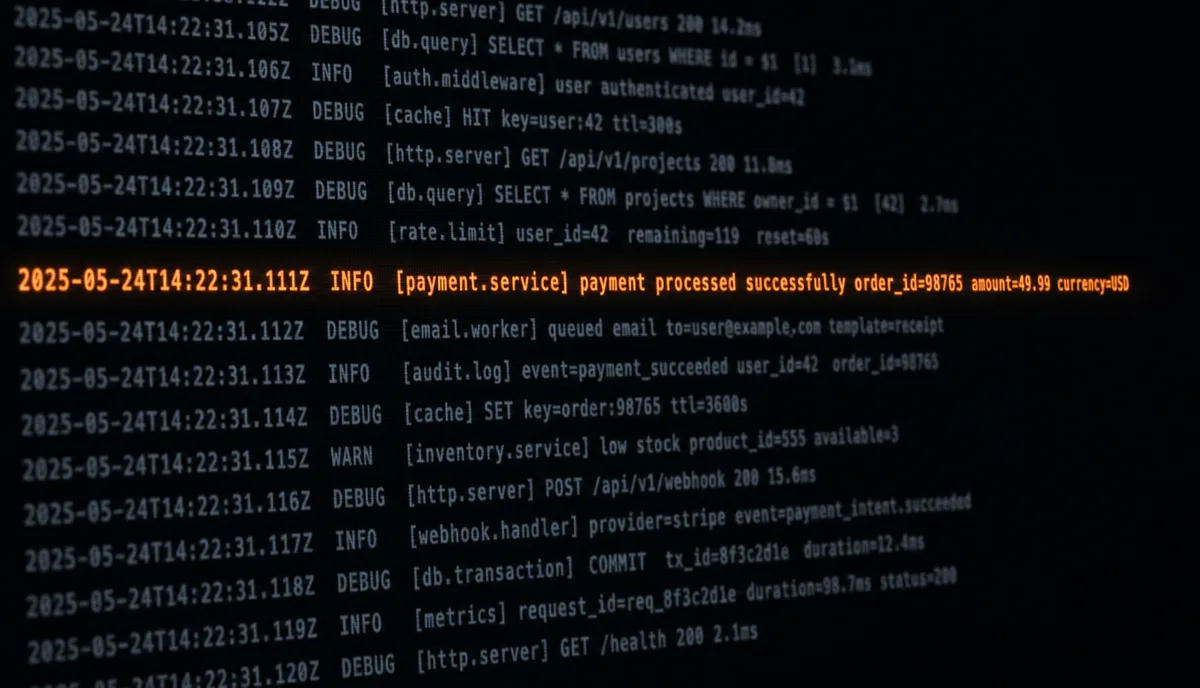
It's 3:14 in the morning. The pager fires. The on-call engineer opens the laptop, half-asleep, five Slack tabs, three dashboards. The #incidents channel has forty-seven alerts from the last two hours — some are duplicates, some are noise from an afternoon deploy, and somewhere in the middle there's the real one: the error that just took down checkout for thirty percent of traffic.
The on-call's first question is rarely "how do I fix it?". It's "what is the error?".
The industry measures the wrong thing
Gartner estimates that a minute of downtime costs about USD 5,600 for a typical SaaS. The number is dramatic — and a little misleading. What weighs on that bill isn't only the time the system is down; it's the time between a system failing and someone understanding what failed. MTTD and MTTR have circulated in the literature for years, but what most teams don't measure is what lives between the two: triage time.
Triage is the silent work that happens before the fix. Reading stack traces, correlating with deploys, checking whether another team has seen the same error, deciding whether to page the database engineer or the front-end one, writing in Slack to ask "has anyone seen this?". It's invisible in the metric, but it eats the clock.
Why traditional alerting doesn't solve it
Most teams have observability tooling. Datadog, Sentry, Grafana, Honeycomb. They collect logs, metrics, traces. The problem is no longer detecting — it's separating what matters from what is noise. When the alerts channel fires fifty times an hour, the human brain learns to ignore all of them.
And there's a structural problem: traditional alerts classify by status code or threshold. "HTTP 500 spike" says little — it could be a real bug, a hot deploy, a customer abusing the API, or a transient database timeout that will resolve itself. A status code does not capture intent. Without intent, there is no priority.
What changes when detection is semantic
Triage treats detection as a reading problem, not a threshold problem. The first three pipeline stages (ingestion, analysis_layer1, triage) read every failure, extract stack trace and message, and classify intent through an LLM — what the failure actually is, the real severity, the first occurrence. Each failure is given a dedup_key derived from the syntax of the exception, so a thousand occurrences of the same bug become a single entry in the work queue.
The practical result: the on-call engineer opens the portal and sees a tight list. Each item already carries the log excerpt, the occurrence count, the time of first appearance, and the diagnostic's initial hypothesis. No hunting required.
Detection isn't about finding errors — it's about finding the right error.
Every observability tool finds errors. The invisible cost of debugging is not in detecting; it's in separating signal from noise fast enough that the engineer can actually think about fixing.
See how Triage's detection pipeline works →